
Venus reflects sunlight with some solar absorption lines shallower than a simple reflection model predicts. Our archival analyses find this apparent line filling with four instruments. Broad fluorescence could produce it. Several tests leave the signal in place, but two substantial alternatives remain: Raman scattering in Venus’s atmosphere and light redistributed by the observing instrument. The observations justify a fluorescence search.
The search began with the absorption model in (Spacek et al. 2026). That paper used Venus reflectivity and a cloud model to infer how strongly the liquid inside cloud droplets must absorb. Its modeled decadic absorption coefficient reaches about 1,278 cm-1 at 375 nm and falls steeply toward 455 nm. Efficient organic pigments could provide this absorption at high concentrations. Their presence was a hypothesis consistent with the optical requirements, not a chemical identification. If conjugated organic molecules account for much of the absorption, it is reasonable to ask whether they return some absorbed sunlight as fluorescence.
Fluorescence follows electronic excitation: a molecule absorbs a photon and later emits a photon, usually with less energy and a longer wavelength. Competing processes turn the excitation into heat or chemical change. Acidity, aggregation, concentration and molecular structure can suppress emission. Strong organic absorption therefore supplies a reason to search; it does not guarantee a detectable glow. A porphyrinoid is one candidate, but this analysis does not require that assignment.
The practical inspiration for this work came from Earth. Satellite spectrometers measure sunlight-induced chlorophyll fluorescence, or SIF, from vegetation and marine phytoplankton. Plant fluorescence has been retrieved from space through solar absorption lines (Joiner et al. 2011). TROPOMI applies the same principle to red fluorescence over land and ocean (Köhler et al. 2020). These observations show how to look for a faint emission against much brighter reflected sunlight.
Dark Fraunhofer lines are already present in sunlight before it reaches a planet. Ordinary reflection carries those lines into the observed spectrum. A broad fluorescence band adds photons inside the lines and between them. The fractional line depths decrease. A matched solar reference lets us measure that decrease even when the broad emission itself is difficult to distinguish from a change in cloud color.
For a solar profile S normalized to unit continuum, adding light F to reflected continuum C gives a normalized profile (S + f)/(1 + f), where f = F/C. The fractional reduction in line depth is q = f/(1 + f). Thus q = 6% corresponds to f = 6.38% under this model.
Earth observations were used for the measurement principle, however with a different fluorescence spectrum. Chlorophyll SIF is red and far-red, with familiar maxima near 685 and 740 nm. A Venus signal in the blue-green would require a different emission spectrum. In selected dark ocean scenes, red SIF reaches about 10% of the measured signal (Köhler et al. 2020). This shows that a several-percent contribution is possible in remote fluorescence measurements. The bright Venus clouds have a different reflected background and energy budget.
The complete analysis is attached as PDF below the summary. The data presented below were not examined by human experts and until verified serve as an illustration. See the acknowledgements.
Results
We first examined public CFHT/ESPaDOnS spectra. The pilot contained 57 Venus spectra and nine Moon or asteroid controls. A denser analysis examined 191 Venus spectra, including overlapping pilot observations, to test changes with time and UV color. A separate sky-channel audit used 42 Venus observations. These sample counts describe overlapping tests and must not be added together. One Jupiter spectrum was tested to see if we can detect line filling due to light interaction with its hydrogen rich atmosphere.
Local fits compared the observations with shifted and broadened solar spectra, a smooth reflected continuum and an additive term. Daytime fits included a second solar component at the terrestrial sky velocity when appropriate. Strong terrestrial absorption was masked, and negative additive coefficients were retained. No positive signal or Gaussian fluorescence band was required. The solar references were the IAG atlases (Reiners et al. 2016; Baker et al. 2020); reflected sunlight from airless bodies provided an empirical check.
We then tested three additional datasets. ESPRESSO supplied 33 individual Venus exposures from September 2018 and same-mode Vesta controls. UVES supplied eleven exposures, ten bright enough for the principal analysis, with raw-data reduction and a separate extraction check. Hubble STIS supplied two usable exposures for the green comparison. These are independent observations and instruments, although some reference spectra and fitting assumptions are shared.
| Dataset | Main result near the green band |
| CFHT ESPaDOnS | Representative 478–523 nm fits give f = 4.3–13.0%, equivalent to q = 4.1–11.5%. Airless controls generally give f near 1%. |
| VLT ESPRESSO | Direct Venus–Vesta comparison gives q = 6.24% over 475–525 nm, or f = 6.66%. |
| VLT UVES | RED580 spectra give q of about 6–7% over 480–520 nm. Positive BLUE dilution also survives an unmerged-order check in one representative spatial row. |
| Hubble STIS | With saturated samples removed and the published slit response used, q is 10.6% and 10.3% over 507–537 nm. These are blended features at lower resolution. |
These values are conditional fit coefficients from the present analyses, not published fluorescence detections. Differences between instruments cannot be interpreted as temporal changes in Venus. Their spectral resolution, sampled clouds, observing geometry and calibration differ.
The strongest reference check changes the proposed spectral shape. ESPRESSO compared directly with Vesta gives q = 5.34% at 406–435 nm, 6.24% at 475–525 nm, 6.35% at 540–585 nm and 4.03% at 650–715 nm. It supports broad dilution through the visible spectrum. No 400 nm point is measured by that fit grid.
Jupiter also shows green filling: f is about 4.2% against the solar atlas and 2.6–3.0% against empirical references. This is consistent with previous observations of solar absorption lines filled by Raman scattering from molecular hydrogen in Jupiter’s atmosphere (Cochran et al. 1981). Recovering filling in a planet where it is already known supports the method’s ability to detect line filling. This checks detection; identifying the cause of Venus’s filling requires separate tests. Jupiter’s Raman contribution and rotational broadening require their own treatment, so its measured filling cannot be subtracted from Venus as a baseline.
The UV-color tests did not find a common positive relation across campaigns. The April 2014 association was positive; other scans did not repeat it. A spatial comparison with Akatsuki could not be completed because usable overlapping cloud regions and secure aperture positions were lacking. We therefore report no measured spatial correlation between UV darkness and green filling.
Modeled fluorescence and cloud absorption
Figure 1 compares the 2026 absorption model with an estimate of the added-light spectrum. The emission interpretation is conditional: all fitted dilution is assigned to a smooth added component, and that component is called fluorescence for this calculation. Raman redistribution or an instrumental contribution would change the inferred curve.
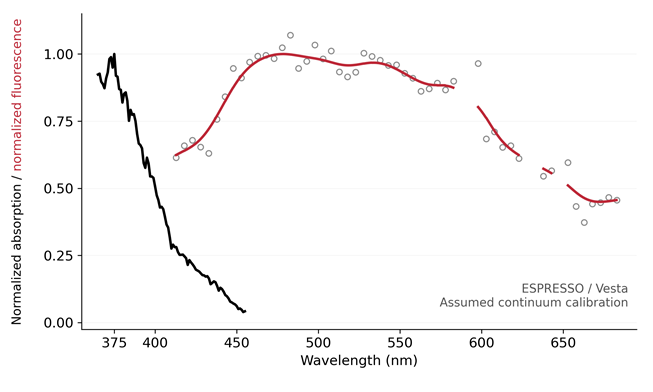
Figure 1. Normalized absorption (in black; from Spacek et al. 2026) and conditional fluorescence (red). The starting measurements are 1,716 accepted 4 nm window fits in 33 ESPRESSO Venus exposures from 2–3 September 2018, compared with a resolution-matched Vesta spectrum observed on 19 November 2018. Assigning all smooth added light to fluorescence gives an energy-spectrum proxy F = fT̄/[mean(S) + f], where f = q/(1 − q), mean(S) averages the normalized Vesta template within each window, and T̄ is an adopted band-mean total Venus flux. This conversion treats the local continuum as constant. T̄ combines reflectivity digitized from Figure 9 of Lee et al. 2022, including the 2020 blue spectrum and V/R/I photometry at phase angle 80°, with TSIS-1 solar irradiance (Coddington et al. 2023). It is not a simultaneous calibration of these apertures. Vacuum wavelengths were converted to air; the 408 and 713 nm windows fall outside the archived continuum range and are omitted, leaving 1,650 fits at 50 centers. Circles show window medians. Red shows a three-window median followed by local linear smoothing with a 10 nm Gaussian bandwidth; gaps remain open. Points and curve are divided by the curve maximum. The absorption and conditional fluorescence curves are normalized independently. No complete Raman or instrumental-wing contribution has been removed; the points have no total-error bars.
The earlier reconstruction used 16 ESPaDOnS spectra and 873 accepted local windows. The “16” referred to spectra, not sixteen isolated solar transitions. The updated figure uses ESPRESSO and its empirical Vesta reference. It retains a broad visible envelope, with appreciable violet emission under the adopted assumptions. No Gaussian emission band was imposed.
Line filling measures a fraction of the local continuum, whose color must be supplied to estimate an emission spectrum. The borrowed continuum and the 2026 absorption inversion also share observational inputs, so their comparison is not fully independent. The figure models light reaching the observer after cloud transport. Its heights give neither an emission efficiency nor a molecular identification.
Tests of other explanations
A false positive here means a false attribution of line filling to fluorescence. Raman filling would be a real planetary signal with a different physical cause. Fluorescence from an abiotic organic mixture or a mineral would still be considered a positive fluorescence signal. The tests below separate effects fitted to the data from physical estimates and explanations still open.
| Possible explanation | Test performed and what it establishes |
| Solar reference and continuum errors | Moon, Ceres and Vesta comparisons, alternative solar atlases, window widths and continuum orders were tested. Green dilution survives. The Vesta comparison reveals a substantial violet reference bias. Controls do not fully match Venus’s extended illumination. |
| Terrestrial sky and sky subtraction | Shifted sky spectra and measured sky channels were fitted. Both ESPaDOnS and ESPRESSO sky fibres contain Venus light. In ESPRESSO, subtracting that fibre creates much of the apparent change between nights. STIS observes above Earth’s atmosphere and retains green dilution. |
| Terrestrial absorption, detector and extraction effects | Mask changes preserve the green signal. Two checked ESPaDOnS raw frames were unsaturated; STIS saturated samples were excluded. Positive UVES BLUE dilution survives an unmerged-order check in one representative spatial row. UVES trap-correction changes q by ≤0.012 percentage points; STIS off-planet background subtraction by about 0.1 point or less. |
| Doppler shifts and ordinary broadening | Local velocity and width were fitted. Modestly broadened solar profiles do not reproduce the larger offsets. Non-Gaussian velocity mixing, solar-disk weighting near the terminator and illumination-dependent response remain incompletely tested. |
| Broad instrumental wings and stray light | Very broad flux-conserving redistribution can closely mimic an additive component. In selected ESPRESSO windows, a hypothetical halo containing about 9% of the response area approaches the additive fit. Its presence has not been measured. This remains a major calibration question. |
| Planetary Raman scattering | Single-event rotational CO₂ templates at 230 and 300 K were tested on ESPaDOnS examples. They did not explain the full larger signal. The test omitted complete cloud transport, multiple Raman events and vibrational contributions. Venus Raman scattering remains unexcluded. |
| Failure of the fitting calculation | Synthetic added signals were injected and recovered near their known amplitudes. This verifies the response of the calculation; it does not identify the original offset or give a complete detection threshold. |
Raman scattering needs particular care. It moves solar photons between wavelengths and can fill Fraunhofer lines in the green as well as the UV. The simple template test is not a calibrated prediction of its strength in Venus’s clouds. Cloud penetration, absorption and multiple scattering alter its spectral dependence; the molecular cross section alone cannot predict the observed curve (Brinkmann 1968; Oklopčić et al. 2016). Time variation therefore does not exclude Raman scattering.
Other mechanisms were assessed by scale or spectral shape, without a full fit. Thermal radiation from a 735 K surface is negligible at 500 nm even before cloud attenuation. Familiar narrow airglow lines do not supply a smooth visible pedestal. Smooth, wavelength-preserving cloud scattering or absorption alone preserves local solar-line contrast, although it changes Raman paths and emission escape. Liquid-droplet Raman, polarization-dependent instrumental response and unspecified chemical emission have not been quantitatively excluded.
Conclusion
The archival work finds repeated apparent solar-line filling on Venus. It survives several reference, sky, mask, extraction and line-width tests, and appears in observations from the ground and from Hubble. Broad sunlight-induced fluorescence is consistent with these results. A cloud biosphere provides a testable explanation for the proposed abundant organic pigments and their possible fluorescence.
One test is circular spectropolarimetry: measuring the handedness of reflected light across wavelength. Biological pigments can produce circular polarization with structure tied to their absorption bands (Sparks et al. 2009). Confirmed fluorescence together with such a signature, unexplained by tested abiotic mechanisms and instrumental effects, could provide compelling evidence for a second known biosphere. Cloud scattering also produces circular polarization (Rossi and Stam 2018); its spectral and viewing-angle dependence must be separated from a pigment signal.
No tested alternative has explained the whole line-filling signal using independently measured parameters. Complete Venus Raman calculations and calibration of broad instrumental redistribution remain necessary. The newer reference and sky tests also limit earlier claims about weak violet filling and large temporal variation.
UV darkness and fluorescence need not correlate exactly: they sample different photon paths and depths. Deeper fluorescence requires both excitation light and an escape path for emitted photons. A failed simple color correlation neither establishes nor rejects fluorescence.
Next observations should combine calibrated intensity and circular-polarization spectra, off-planet sky, measured instrumental response, reflected-solar controls and contemporaneous UV imaging. Laboratory measurements in concentrated sulfuric acid should test biological and abiotic candidates. The published Autofluorescence Nephelometer design would test cloud particles in situ with 440 nm excitation and 470–520 nm fluorescence detection (Baumgardner et al. 2022).
Full report and acknowledgements
Numerical models presented here were generated by ChatGPT-6. Although fully qualified to present the florescence hypothesis and prompt the AI, the author doesn’t feel fully qualified to examine the presented data. A team of experts has been invited to co-author the data to be presented in a peer reviewed publication.
References
Baker et al. 2020. The IAG Solar Flux Atlas: Telluric Correction with a Semiempirical Model. ApJS 247, 24.
Baumgardner et al. 2022. Deducing the Composition of Venus Cloud Particles with the Autofluorescence Nephelometer. Aerospace 9, 492.
Brinkmann 1968. Rotational Raman Scattering in Planetary Atmospheres. ApJ 154, 1087.
Cochran et al. 1981. Raman scattering in the Jovian atmosphere. ApJ 247, 734–740.
Coddington et al. 2023. Version 2 of the TSIS-1 Hybrid Solar Reference Spectrum and Extension to the Full Spectrum. Earth and Space Science 10, e2022EA002637.
Joiner et al. 2011. First observations of global and seasonal terrestrial chlorophyll fluorescence from space. Biogeosciences 8, 637–651.
Köhler et al. 2020. Global Retrievals of Solar-Induced Chlorophyll Fluorescence at Red Wavelengths With TROPOMI. GRL 47, e2020GL087541.
Lee et al. 2022. Reflectivity of Venus’s Dayside Disk During the 2020 Observation Campaign: Outcomes and Future Perspectives. PSJ 3, 209.
Oklopčić et al. 2016. Raman Scattering by Molecular Hydrogen and Nitrogen in Exoplanetary Atmospheres. ApJ 832, 30.
Reiners et al. 2016. The IAG solar flux atlas: Accurate wavelengths and absolute convective blueshift in standard solar spectra. A&A 587, A65.
Rossi and Stam 2018. Circular polarization signals of cloudy (exo)planets. A&A 616, A117.
Spacek et al. 2026. A Model of UV–Blue Absorbance in Bulk Liquid of Venusian Cloud Aerosols Is Consistent with Efficient Organic Absorbers at High Concentrations. Astrobiology 26, 727–739.
Sparks et al. 2009. Detection of circular polarization in light scattered from photosynthetic microbes. PNAS 106, 7816–7821.
The numerical Venus and Jupiter results are from the accompanying archival analyses dated 25 September 2026. The accompanying full report and calculations attachment retain the exposure identifiers, fit tables, controls and code. They are exploratory analyses, not a published fluorescence identification.